Historical data shows that after previous major US government shutdowns, US stocks, gold, and Bitcoin have exhibited different price movements. This time, with the government reopening and federal funds resuming circulation, which assets are likely to benefit?
![图片[1]-Does the end of the shutdown mean a market upturn? Let’s look at the historical price movements of US stocks, gold, and Bitcoin after each US government reopening.-OzABC](https://www.ozabc.com/wp-content/uploads/04673b23altincakildidolarsahlandibitcoinisebarajacokyakinistefedfaizkararisonrasipiyasalardasondurum17345496495062-1140x570-1-800x400.jpg)
At 5 a.m. on November 13, a government shutdown crisis that lasted 43 days and set a record in U.S. history was about to come to an end.
The U.S. House of Representatives passed a temporary funding bill by a vote of 222-209 on the evening of November 12 local time, and it was signed into law by Trump.
Thus, the shutdown stalemate that began on October 1st came to an end.
During these 43 days, widespread flight delays, disruptions to food aid programs, and the suspension of economic data releases have cast uncertainty over all aspects of the world’s largest economy.
How will the market react once the shutdown ends?
For investors in the crypto and traditional financial markets, this is not only the end of a political event, but also an experimental window to observe how asset prices respond to the “disappearance of uncertainty”.
Historical data shows that after several major US government shutdowns, US stocks, gold, and Bitcoin have all exhibited different price trends.
Now that the government has reopened and federal funds are flowing again, which assets are likely to benefit?
If you don’t have time to read, the image below can help you quickly grasp the key points.
The following details will help you learn from history and become a smart investor.
How exactly does a shutdown affect investment?
To understand the market reaction after the shutdown ends, we must first understand how the government shutdown affects asset prices.
A government shutdown is definitely not as simple as “civil servants being given a holiday”.
According to estimates by the Congressional Budget Office (CBO), the 35-day shutdown in 2018-2019 resulted in a permanent GDP loss of approximately $3 billion and a temporary economic activity delay of approximately $8 billion.
![图片[2]-Does the end of the shutdown mean a market upturn? Let’s look at the historical price movements of US stocks, gold, and Bitcoin after each US government reopening.-OzABC](https://www.ozabc.com/wp-content/uploads/does-the-end-of-the-shutdown-mean-a-market-upturn-lets-look-at-the-historical-price-movements-of-us-stocks-gold-and-bitcoin-after-each-us-government-reopening.jpeg)
This 43-day shutdown has broken historical records. Although the CBO has not yet released an economic impact assessment of this shutdown, given its longer duration and wider impact, the economic losses are likely to significantly exceed those of 2018-2019.
A real reduction in economic activity will be reflected in key indicators such as GDP growth rate, consumption data, and corporate profits.
But more important than the economic losses is the uncertainty itself.
One of the core logics of financial markets is that investors dislike uncertainty.
When the future is unpredictable, funds tend to reduce holdings of high-risk assets (technology stocks, growth stocks), increase holdings of safe-haven assets (gold, US Treasury bonds, etc.), reduce leverage, and hold cash to wait and see.
Conversely, what happens when the shutdown ends? Theoretically, the end of the shutdown means:
- Policy certainty returns – government funding is secured, at least for the next few months.
- Economic data releases resume – Investors regain tools to assess economic fundamentals
- The resumption of fiscal spending – delayed purchases, salaries, and benefits are being disbursed, providing a short-term boost to the economy.
- Risk appetite recovers – the worst-case scenario has been averted, and funds are once again chasing returns.
This usually triggers a “relief rally” because the elimination of uncertainty is itself a positive factor.
However, it should be noted that this rebound may not be sustainable.
After the shutdown ends, the market will quickly return to focusing on economic fundamentals; therefore, we believe the impact of the shutdown on the market can be divided into two levels:
- Short term (1-2 weeks): The recovery in sentiment following the elimination of uncertainty is generally bullish for risk assets.
- Medium term (1-3 months): Depends on whether the economic fundamentals have truly been damaged, as well as other macroeconomic factors.
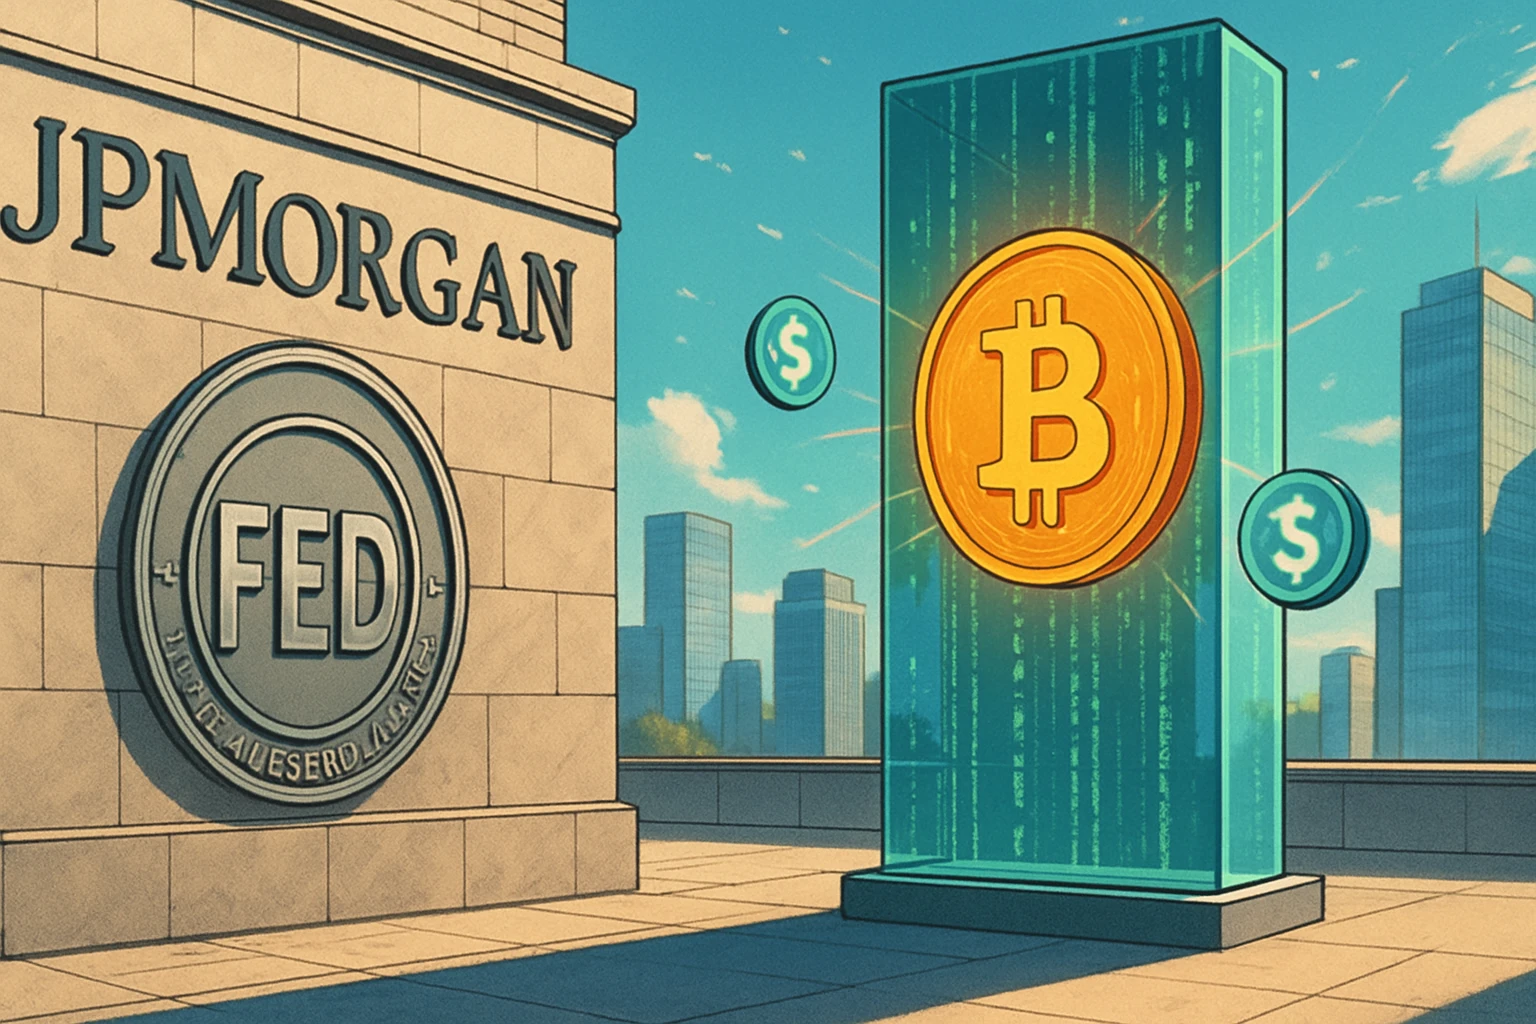
For the crypto market, there is another special consideration: the resumption of operations by regulatory agencies.
During the shutdown, agencies such as the SEC and CFTC were essentially at a standstill, with approval processes suspended and enforcement actions delayed. How these agencies will “catch up” when the government reopens is a variable worth watching.
Next, let’s look at historical data to see how US stocks, gold, and Bitcoin actually performed after the last few major shutdowns.
A historical review of US stocks: After a shutdown ends, there is always a “comforting rebound”.
Let’s focus on three prolonged shutdowns that had a significant impact on the market, and see how investors responded with their real money in the US stock market when the government reopened.
As can be seen:
1. December 1995 shutdown (21 days): On the eve of the tech bubble, a moderate rise.
On December 16, 1995, the Clinton administration and the Republican-controlled Congress reached an impasse over a budget balancing plan, forcing the government to shut down.
Market performance:
- One month later: The S&P 500 rose to 656.07 (+6.1%), the Nasdaq to 1093.17 (+5.9%), and the Dow Jones to 5539.45 (+6.6%).
- Three months later: S&P 500 closed at 644.24 (+4.2%), Nasdaq at 1105.66 (+7.1%), and Dow Jones at 5594.37 (+7.6%).
This is more like a typical case of rising first and then correcting. After a one-month shutdown, all three major indices recorded a rebound of around 6%, but by three months the gains had narrowed, with the S&P 500 even falling back from its one-month high.
Although it happened a long time ago, considering the political and economic environment at the time, the underlying reason may be that after the market digested the short-term positive impact of the end of the shutdown, it returned to fundamental pricing.
In early 1996, the US economy was just beginning its “golden age.” With the advent of personal computers and the internet, technological development was in its infancy, inflation was moderate, and the market itself was on a long-term upward trend. The shutdown was more like an interlude.
2. October 2013 shutdown (16 days): US stocks break through pre-financial crisis highs.
On October 1, 2013, Republicans attempted to force the Obama administration to delay the implementation of the Affordable Care Act through a government shutdown, leading to another government shutdown. This shutdown lasted 16 days, with an agreement finally reached in the early hours of October 17.
Market performance:
- One month later: The S&P 500 rose to 1791.53 (+3.4%), the Nasdaq to 3949.07 (+2.2%), and the Dow Jones to 15976.02 (+3.9%).
- Three months later: S&P 500 closed at 1838.7 (+6.1%), Nasdaq at 4218.69 (+9.2%), and Dow Jones at 16417.01 (+6.8%).
This shutdown occurred at a special historical juncture: October 2013 was the time when the US stock market emerged from the shadow of the financial crisis and broke through the 2007 high.
The end of the shutdown and the technical breakthrough occurred almost simultaneously, coupled with the Federal Reserve’s ongoing QE3 quantitative easing program, leading to extremely optimistic market sentiment. The Nasdaq rose nearly 10% in three months, significantly outperforming traditional blue-chip stocks, with technology stocks once again leading the rebound.
3. December 2018 shutdown (35 days): Bear market bottom reversal, the strongest rebound since the shutdown.
On December 22, 2018, Trump insisted on $5.7 billion in funding for the US-Mexico border wall, leading to a stalemate with the Democrats. This standoff lasted until January 25, 2019, setting a record for the longest shutdown at the time (35 days), which was not surpassed until the current 42-day shutdown.
Market performance:
- One month later: The S&P 500 rose to 2796.11 (+4.9%), the Nasdaq to 7554.46 (+5.4%), and the Dow Jones to 26091.95 (+5.5%).
- Three months later: S&P 500 closed at 2926.17 (+9.8%), Nasdaq at 8102.01 (+13.1%), and Dow Jones at 26597.05 (+7.5%).
This was the strongest rebound among the three shutdowns, and there were special reasons behind it.
In the fourth quarter of 2018, US stocks plummeted nearly 20% from their highs due to the Federal Reserve’s interest rate hikes and trade frictions, hitting a low point on December 24.
The end of the shutdown and the market bottoming out occurred almost simultaneously . Coupled with the Federal Reserve’s subsequent policy shift to pause interest rate hikes, these two positive factors may have driven a strong rebound.
The Nasdaq’s 13% gain over three months further confirms the high resilience of tech stocks during periods of risk appetite recovery.
Looking back at historical data on US stock markets after shutdowns, three clear patterns emerge:
First, a short-term rebound is highly probable. Within a month of the three shutdowns, all three major indices rose, with gains ranging from 2% to 7%. The elimination of uncertainty is itself a positive factor.
Second, technology stocks tend to outperform the broader market. The Nasdaq rose 7.1%, 9.2%, and 13.1% in the three months, respectively, all significantly higher than the Dow Jones’ 7.6%, 6.8%, and 7.5%.
Third, the medium-term trend depends on the macroeconomic environment. The performance in the 1-3 months after the shutdown ended varies greatly. The rise followed by a correction in 1996, the continuous rise in 2013, and the strong rebound in 2019 all had their own macroeconomic logic, rather than the shutdown itself.
A Historical Review of Gold Prices: Price Movements Do Not Depend on the Market Halt Itself
When we turn our attention to gold, we discover a story quite different from that of the stock market.
1. Shutdown in December 1995 (21 days): Minor fluctuations
Gold price performance:
- End of the shutdown (January 1996): $399.45/ounce
- One month later (February 1996): $404.76 (+1.3%)
- Three months later (April 1996): $392.85 (-1.7%)
The political shutdown had a negligible impact on gold prices.
2. October 2013 shutdown (16 days): continued correction
Gold price performance:
- End of shutdown (October 2013): $1320/ounce
- One month later (November 2013): $1280 (-3.0%)
- Three months later (January 2014): $1240 (-6.1%)
This was the weakest performance for gold during the three shutdowns. 2013 was a bear market year for gold, with prices falling from $1,700 at the beginning of the year to $1,200 at the end, a drop of more than 25% for the year.
The underlying reason is that the Federal Reserve began discussing tapering quantitative easing, leading to a stronger dollar and downward pressure on gold prices. After the shutdown ended, as uncertainty subsided, gold’s safe-haven appeal weakened further, and prices fell more rapidly.
3. December 2018 shutdown (35 days): Initial rise followed by a pullback
Gold price performance:
- Lockdown ended (January 2019): $1290/ounce
- One month later (February 2019): $1320 (+2.3%)
- Three months later (April 2019): $1290 (0%)
During this shutdown, US stocks experienced the crash of late 2018, and heightened risk aversion pushed gold prices from $1230 to $1290. After the shutdown ended, gold prices briefly surged to $1320, but as the stock market rebounded and risk appetite recovered, gold prices fell back to their levels at the end of the shutdown, resulting in zero change over three months.
During the shutdowns of 2013 and 1996, the stock market rose 3-6% after the shutdowns ended, while gold either fell (-6.1% in 2013) or remained flat (-1.7% in 1996).
This aligns with the common perception that when uncertainty is eliminated and risk appetite recovers, funds flow from safe-haven assets to risky assets.
If history repeats itself, gold may face the following two scenarios after this 42-day shutdown ends:
Scenario 1: Risk aversion subsides rapidly. If gold prices have already risen due to safe-haven demand during the shutdown, the end of the shutdown may trigger profit-taking, causing gold prices to pull back by 5-10% in the short term. This was most evident in the 2013 case.
Scenario 2: Macroeconomic risks remain. If the shutdown ends but macroeconomic concerns such as US fiscal problems, the debt ceiling, and the risk of economic recession persist, gold may maintain its strength or even continue to rise.
After all, the shutdown is only temporary.
Judging from the current gold price, the end of the shutdown may alleviate short-term safe-haven demand, but it is unlikely to change the long-term upward trend of gold.
A Historical Review of Bitcoin: Limited Sample Size, but Still Insightful
Finally, we come to the question that crypto investors care about most: What will happen to Bitcoin after the shutdown ends?
Frankly, historical data is extremely limited. Bitcoin didn’t exist when the shutdown occurred in 1996, and BTC’s market capitalization was too small and it was during a super bull market when the shutdown occurred in 2013. The only truly relevant period was 2018-2019.
1. October 2013 shutdown (16 days): A brief interlude in the bull market, not significantly related to the shutdown.
BTC price performance:
- Lockdown ended (October 17, 2013): $142.41
- One month later: $440.95 (+209.6%)
- 3 months later: $834.48 (+485.9%)
This data looks extremely exaggerated, tripling in one month and nearly six times in three months.
2013 was one of the craziest bullish years in Bitcoin history, with a surge of over 5,000% throughout the year, rising from $13 at the beginning of the year to a peak of $1,147 at the end.
October was the acceleration phase of this super bull market. BTC had just experienced a sharp drop after the FBI seized “Silk Road,” and after a brief period of panic, the market quickly rebounded and began its most frenzied topping phase.
However, this shutdown has almost no causal relationship with the price movement of BTC. In the context of BTC’s price logic, the government shutdown is more like a noise-level event.
2. December 2018 shutdown (35 days): Bear market bottom, key turning point
BTC price performance:
- Lockdown ended (January 25, 2019): $3607.39
- One month later: $3807 (+5.5%)
- 3 months later: $5466.52 (+51.5%)
感谢您的支持